11

I would like to generate a random correlation matrix such that the distribution of its off-diagonal elements looks approximately like normal. How can I do it?

The motivation is this. For a set of $n$ time series data, the correlation distribution often looks quite close to normal. I would like to generate many "normal" correlation matrices to represent the general situation and use them to calculate risk number.


I know one method, but the resulting standard deviation (of the distribution of the off-diagonal elements) is too small for my purpose: generate $n$ uniform or normal random rows of a matrix $\mathbf X$, standardize the rows (subtract the mean, divide by standard deviation), then the sample correlation matrix $\frac{1}{n-1}\mathbf X \mathbf X^\top$ has normally distributed off-diagonal entries [Update after comments: standard deviation will be $\sim n^{-1/2}$].

Can anyone suggest a better method with which I can control the standard deviation?

amoeba
  • 93,463
  • 28
  • 275
  • 317
Richard
  • 157
  • 5
  • 1
    @Richard, thanks for your question. Unfortunately, the method you describe above will *not* produce entries that are normally distributed. The diagonals are 1 with probability one and the off-diagonals are bounded between $-1$ and $+1$. Now, the *rescaled* entries will converge asymptotically to a normal distribution centered around zero. Can you give us more information about the problem you're actually trying to solve? And, why do you want "normally distributed" off diagonals? – cardinal Apr 28 '11 at 22:47
  • @cardinal, thank you for your comment. The purpose is to simulate the correlations of assets, which often have normal look distribution. The previous described matrix look quite close to normal when looking at qqplot. But you are rWould you explain the meaning of "rescaled" entries? – Richard Apr 28 '11 at 23:01
  • @Richard In your followup to @cardinal, please explain how you plan to relate *correlation* to *standard deviation*: the two are different and almost independent. – whuber Apr 28 '11 at 23:07
  • 1
    @Richard, what I mean was, suppose $X = (X_1,X_2,\ldots,X_n)$ and $Y = (Y_1,Y_2,\ldots,Y_n)$ are two independent vectors such that the entries of each are i.i.d. standard normal. Compute $\hat{\rho}_n = s_{xy} / (s_x s_y)$; that is, the sample correlation between $X$ and $Y$. Then $n^{1/2} \hat{\rho}_n$ converges in distribution to a standard normal random variable. By "rescaled", I meant the multiplication by $n^{1/2}$ which is what is required to obtain a non degenerate limiting distribution. – cardinal Apr 28 '11 at 23:11
  • @whuber sure. Say we have 50 assets or random variables. Then the correlation matrix is 50 by 50 matrix. There are 50x49 off diagonal entries. Those entries look normally distributed. – Richard Apr 28 '11 at 23:12
  • 1
    @Richard, the essence of the "problem" is that by making two restrictions (a) that the norms of each row are 1 and (b) that the entries are generated from a random sample, you necessarily are forcing the correlations to be quite small (on the order of $n^{-1/2}$. The reason is that you can't have arbitrarily large correlations between rows and still get the norms of each row to be 1 in the presence of so much independence. – cardinal Apr 28 '11 at 23:18
  • @cardinal, this is an interesting part. I thought the entries in the correlation matrix defined earlier are dependent. So looking at the distribution of one entry cannot represent the distribution of all entries. although each entry has the ditribution as you describe. – Richard Apr 28 '11 at 23:18
  • @Richard, yes, the off-diagonals are necessarily dependent. In fact, by renormalizing each row of the generating matrix, you *start out* with dependent random variables! But, the dependence is necessarily weak and *must* grow weaker as the dimension (number of stocks) increases. – cardinal Apr 28 '11 at 23:20
  • 1
    ...now, you can get larger correlations in magnitude by *first* correlating the rows among themselves before renormalizing. But, you essentially only have one parameter to play with, so both the asymptotic mean and variance will be tied to that parameter. So, that probably won't give you the flexibility you seem to want, either. – cardinal Apr 28 '11 at 23:22
  • @cardinal, that's a good point. Another source of dependency comes from matrix multiplication. – Richard Apr 28 '11 at 23:29
  • @cardinal, when you say first correlating the rows then renormalize, could you explain that? – Richard Apr 28 '11 at 23:31
  • @cardinal, I guess you mean calculate the covariance matrix then correlation matrix – Richard Apr 28 '11 at 23:34
  • 1
    Sure, let's take a simple case. Call the generating matrix $X$, which we'll assume to be $m \times n$ without loss of generality. Now, generate the *columns* of $X$ as i.i.d. *vectors* such that the elements of each vector are standard normal random variables that are equicorrelated with correlation $\rho$. Now, use the procedure you have been. Let $\hat{\rho}_{ij}$ denote the sample correlation between the $i$th and $j$th *row* of $X$. Then for fixed $m$, letting $n \to \infty$, $n^{1/2} (\hat{\rho}_{ij} - \rho)$ converges in distribution to a $\mathcal{N}(0,(1-\rho^2)^2)$ random variable. – cardinal Apr 28 '11 at 23:38
  • @cardinal, I have a question here, also related to the 3rd comments you made. my procedure basically calculate the correlation entries by taking dot product of any two rows. Is it the same as the sample correlation you described here? – Richard Apr 28 '11 at 23:57
  • @cardinal, yes, essentially. The sample correlation would normally remove the sample mean from each vector before normalizing and taking the dot product, but that is a minor detail of little consequence here. – cardinal Apr 29 '11 at 00:00
  • @cardinal, thank you for your help. I need to be off line now. I will post further questions later. We will continue our discussion. Thanks! – Richard Apr 29 '11 at 00:00
  • 1
    Why the down vote on this question? – cardinal Apr 29 '11 at 02:44
  • @cardinal, From your comment, it seems we can get sd of normal close to 1. – Richard May 01 '11 at 11:53
  • @cardinal The downvote is because my request for a clarification got no response, but I should have made a further comment. As far as I can tell, this still is not a well-formulated question because it is based on a false assumption ($AA^T$ will not have normally distributed entries) and is nonsensical (correlation is not standard deviation). The downvote does not mean the question is *uninteresting*; it means it remains ill-posed. – whuber May 07 '11 at 01:46
  • @whuber, agreed on all counts. I have been trying to extract what problem the OP is trying to solve. But, have failed to get a clear picture (yet). Perhaps I have not yet asked the right question. – cardinal May 07 '11 at 01:49
  • thanks for all the comments. Can I try to clarity the question? – Richard May 07 '11 at 02:06
  • The motivation is this. For a set of n time series data, the correlation distribution often look quite close to normal. I would like to generate many "normal" correlation matrices to represent the general siutation and use them to calculate risk number. Do you think I answer your question? – Richard May 07 '11 at 02:11
  • @Richard Thanks, that's much better. I begin to see what you are looking for. Perhaps we should clean up this thread: would you mind putting your clarifications as edits in the original question? Then we can delete many of these comments, remove the downvote (which cannot be done until the question itself is modified), and make some progress. Consider pursuing @Rick Wicklin's suggestion below, too: it looks like he is on to something you might find helpful. – whuber May 07 '11 at 02:15
  • @whuber, I guess I should not say normally distributed. I should say "approximately" normally distributed in the sense that for large n, if you plot the qqnorm of the entries, the are almost on the same straight line as normal. – Richard May 07 '11 at 02:21
  • @cardinal, I am very interested in your comments on April 28 23:38. Would you recommend a reference that discusses this kind of analysis? – Richard May 07 '11 at 02:29
  • @whuber, I have clarify the original question. Thanks for the suggestion. – Richard May 07 '11 at 02:39
  • @Richard, this is a fairly straightforward application of the delta method. I don't have a reference immediately handy, but Chapters 12 and/or 13 (I believe) of Lehmann and Romano, *Testing Statistical Hypotheses*, 3rd. ed. should cover this. If I recall, it may even have this example. – cardinal May 07 '11 at 13:14
  • @Richard, in the previous comment of mine that you reference, note that there is a multiplication by $\sqrt{n}$ in order to get this convergence of distribution. Note also that using a sequence of independent normals results in the largest asymptotic variance. So, crudely, the off-diagonals will have mean correlation of zero and variance of about $n^{-1/2}$. – cardinal May 07 '11 at 13:17

4 Answers4

5

I have first provided what I now believe is a sub-optimal answer; therefore I edited my answer to start with a better suggestion.


Using vine method

In this thread: How to efficiently generate random positive-semidefinite correlation matrices? -- I described and provided the code for two efficient algorithms of generating random correlation matrices. Both come from a paper by Lewandowski, Kurowicka, and Joe (2009).

Please see my answer there for a lot of figures and matlab code. Here I would only like to say that the vine method allows to generate random correlation matrices with any distribution of partial correlations (note the word "partial") and can be used to generate correlation matrices with large off-diagonal values. Here is the relevant figure from that thread:

Vine method

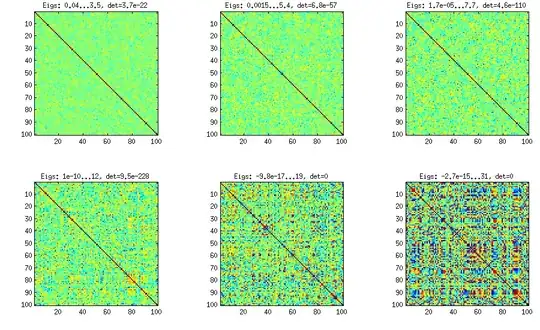
The only thing that changes between subplots, is one parameter that controls how much the distribution of partial correlations is concentrated around $\pm 1$. As OP was asking for an approximately normal distribution off-diagonal, here is the plot with histograms of the off-diagonal elements (for the same matrices as above):

Off-diagonal elements

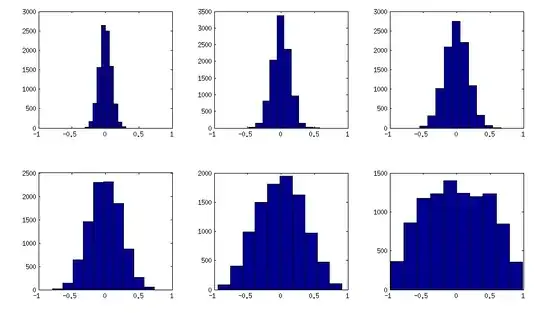
I think this distributions are reasonably "normal", and one can see how the standard deviation gradually increases. I should add that the algorithm is very fast. See linked thread for the details.


My original answer

A straight-forward modification of your method might do the trick (depending on how close you want the distribution to be to normal). This answer was inspired by @cardinal's comments above and by @psarka's answer to my own question How to generate a large full-rank random correlation matrix with some strong correlations present?

The trick is to make samples of your $\mathbf X$ correlated (not features, but samples). Here is an example: I generate random matrix $\mathbf X$ of $1000 \times 100$ size (all elements from standard normal), and then add a random number from $[-a/2, a/2]$ to each row, for $a=0,1,2,5$. For $a=0$ the correlation matrix $\mathbf X^\top \mathbf X$ (after standardizing the features) will have off-diagonal elements approximately normally distributed with standard deviation $1/\sqrt{1000}$. For $a>0$, I compute correlation matrix without centering the variables (this preserves the inserted correlations), and the standard deviation of the off-diagonal elements grow with $a$ as shown on this figure (rows correspond to $a=0,1,2,5$):

random correlation matrices

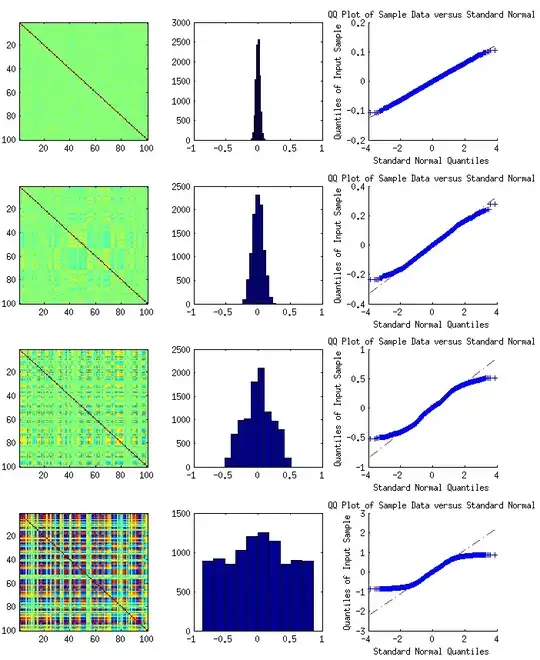
All these matrices are of course positive definite. Here is the matlab code:

offsets = [0 1 2 5];
n = 1000;
p = 100;

rng(42) %// random seed

figure
for offset = 1:length(offsets)
    X = randn(n,p);
    for i=1:p
        X(:,i) = X(:,i) + (rand-0.5) * offsets(offset);
    end
    C = 1/(n-1)*transpose(X)*X; %// covariance matrix (non-centred!)

    %// convert to correlation
    d = diag(C);
    C = diag(1./sqrt(d))*C*diag(1./sqrt(d));

    %// displaying C
    subplot(length(offsets),3,(offset-1)*3+1)
    imagesc(C, [-1 1])

    %// histogram of the off-diagonal elements
    subplot(length(offsets),3,(offset-1)*3+2)
    offd = C(logical(ones(size(C))-eye(size(C))));
    hist(offd)
    xlim([-1 1])

    %// QQ-plot to check the normality
    subplot(length(offsets),3,(offset-1)*3+3)
    qqplot(offd)

    %// eigenvalues
    eigv = eig(C);
    display([num2str(min(eigv),2) ' ... ' num2str(max(eigv),2)])
end

The output of this code (minimum and maximum eigenvalues) is:

0.51 ... 1.7
0.44 ... 8.6
0.32 ... 22
0.1 ... 48
amoeba
  • 93,463
  • 28
  • 275
  • 317
  • can you plot the value of the smallest eigenvalues you obtain using this method alongside you plots? – user603 Nov 19 '14 at 13:35
  • 1
    Without changing the figure, I can simply write here that the smallest eigenvalues are 0.5, 0.4, 0.3, and 0.1 respectively (for each row of my figure). The largest ones grow from 1.7 to 48. – amoeba Nov 19 '14 at 13:39
  • but are these the eigenvalues of the correlation matrix or those of X'X?. – user603 Nov 19 '14 at 16:29
  • These are the eigenvalues of my $C$ matrix, which is normalized to have ones on the diagonal, -- so of the correlation matrix. I updated my answer so that you can see it in the code. May I ask what makes you doubt that this is possible? Is there any reason to think that large correlation matrices should have very small off-diagonal elements? – amoeba Nov 19 '14 at 16:40
  • I don't think its impossible, I just couldn't see it from the code (having not used matlab for years at this point) – user603 Nov 19 '14 at 16:53
1

You might be interested in some of the code at the following link:

Correlation and Co-integration

bill_080
  • 3,458
  • 1
  • 20
  • 21
1

If you are trying to generate random correlation matrices, consider sampling from the Wishart distribution. This following question provides information the Wishart distribution as well as advice on how to sample: How to efficiently generate random positive-semidefinite correlation matrices?

Rick
  • 666
  • 3
  • 9
  • But can one control the standard deviation of the resulting off-diagonal elements with parameters of the Wishart distribution? If so, how? – amoeba Nov 19 '14 at 13:43
1

This is not a very sophisticated answer, but I can't help but think it's still a good answer...

If your motivation is that correlation parameters produced by time series data tend to look normal, why not just simulate time series data, calculate the correlation parameters and use those?

You may have a good reason for not doing this, but it's not clear to me from your question.

Cliff AB
  • 17,741
  • 1
  • 39
  • 84