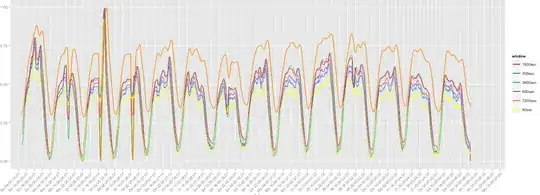
I try to find out the smallest window size for calculating statistical values on a stream. To illustrate my problem: I record the average car counts per brand on a street using different sliding windows. The graphs below show the average value using sliding windows from 90 to 7200 seconds. Of course the absolute figures are different, because if a window is larger then more values can be counted, but the time-series progress look very similar. Thus I assume that window size of 90 seconds is sufficient to decently reflect the average car count per brand.
Now my question is thus, how do I not only visually but correctly provide statistical evidence for the similarity of the time-series data and determine a reasonable lower size of the sliding window?
Or to say, why should I "slow down" my system by using data from a 7200 second window, if I can do everything with data from 90 seconds.
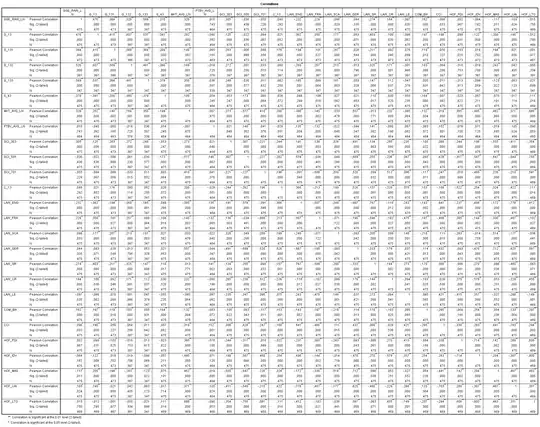
The histogram of the data suggest the data is not normally distributed, thus I used Spearman's rank correlation. The correlation values are all above 0.8, which would support my claim. But is this test reasonable for this purpose and are there any methods better suited for this type of analysis?
ARMA or should I do tests on the distributions of the moving average values, like Kruskal-Wallis for the distribution itself or Levene's test for the variances?