9

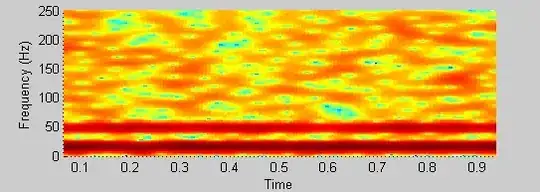
My knowledge of wavelets is less than epsilon. Bear with me. If I have a signal of two well separated sinusoids (15 and 48 Hz) plus some random noise, I can clearly make out the two in a spectrogram (the two stripes in my picture);

t=0:0.002:1;   % fs = 500 Hz
x=4*sin(2*pi*15*t)+2*cos(2*pi*48*t);
xn = x + randn(size(x));
figure(1);
plot(xn);
figure(2);
spectrogram(xn, 64, 60, [], 500);

enter image description here enter image description here

but, using 'wscalogram', I cant say I can tell the components apart:

    coefs = cwt(xn,1:64,'db8','scalCNT');
    wscalogram('image',coefs,'scales',1:64,'ydata',xn);

enter image description here

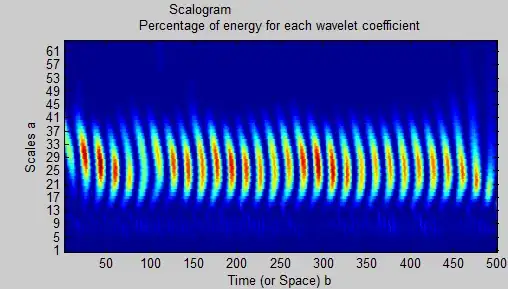
Is there a way to read from the scalogram that there are 2 distinct sinusoids and if so, how can I separate them using wavelet decomposition and filtering? I thought that perhaps my choice of wavelet ('db8') is not optimal but I can't see much difference using other types ad larger (or smaller) number of scales. Clearly I am missing something about where and when and on what to apply wavelets.

Thanks

user1641496
  • 395
  • 4
  • 10
  • I would like to know what is the meaning of the y axis. Who can I read the frequency in the y axis in the Wavelet Scalogram? – Nader Rachid Apr 27 '20 at 20:51

2 Answers2

4

Wavelets are ideal for localized events. The Fourier Transform represents a function as a sum of sines and cosines, neither of which are localized. The spectrogram does keep some time information, at the expense of frequency resolution

In your case, the signal is not localized at all. The spectrogram smears your 15 Hz band over several Hz, as it captures some time information, and the scalogram flat out fails.

MSalters
  • 741
  • 3
  • 10
1

Yes, you are missing something :) Although you have tried different wavelet families you should use the GaborWavelet. I wrote this in Mathematica, but you can do it in any environment you want.

cwd = ContinuousWaveletTransform[Table[4 Sin[2 Pi 15 t] + 2 Cos[2 Pi 48 t] +   
               RandomReal[{-.5, .5}], {t, 0, 5 \[Pi], .01}], GaborWavelet[]]

WaveletScalogram[cwd, ColorFunction -> "RoseColors"]

Mathematica graphics

Sektor
  • 308
  • 3
  • 6